Data Visualizations

Data Viz | Information Graphics | Custom Icons

Amplify your message with beautifully branded information graphics.

You’ve done the hard work so other people don’t have to.

Pouring over pages of data and information and synthesizing them into key findings, recommendations, and strategies takes a lot of work. Let’s work together to ensure your audience gets the message.
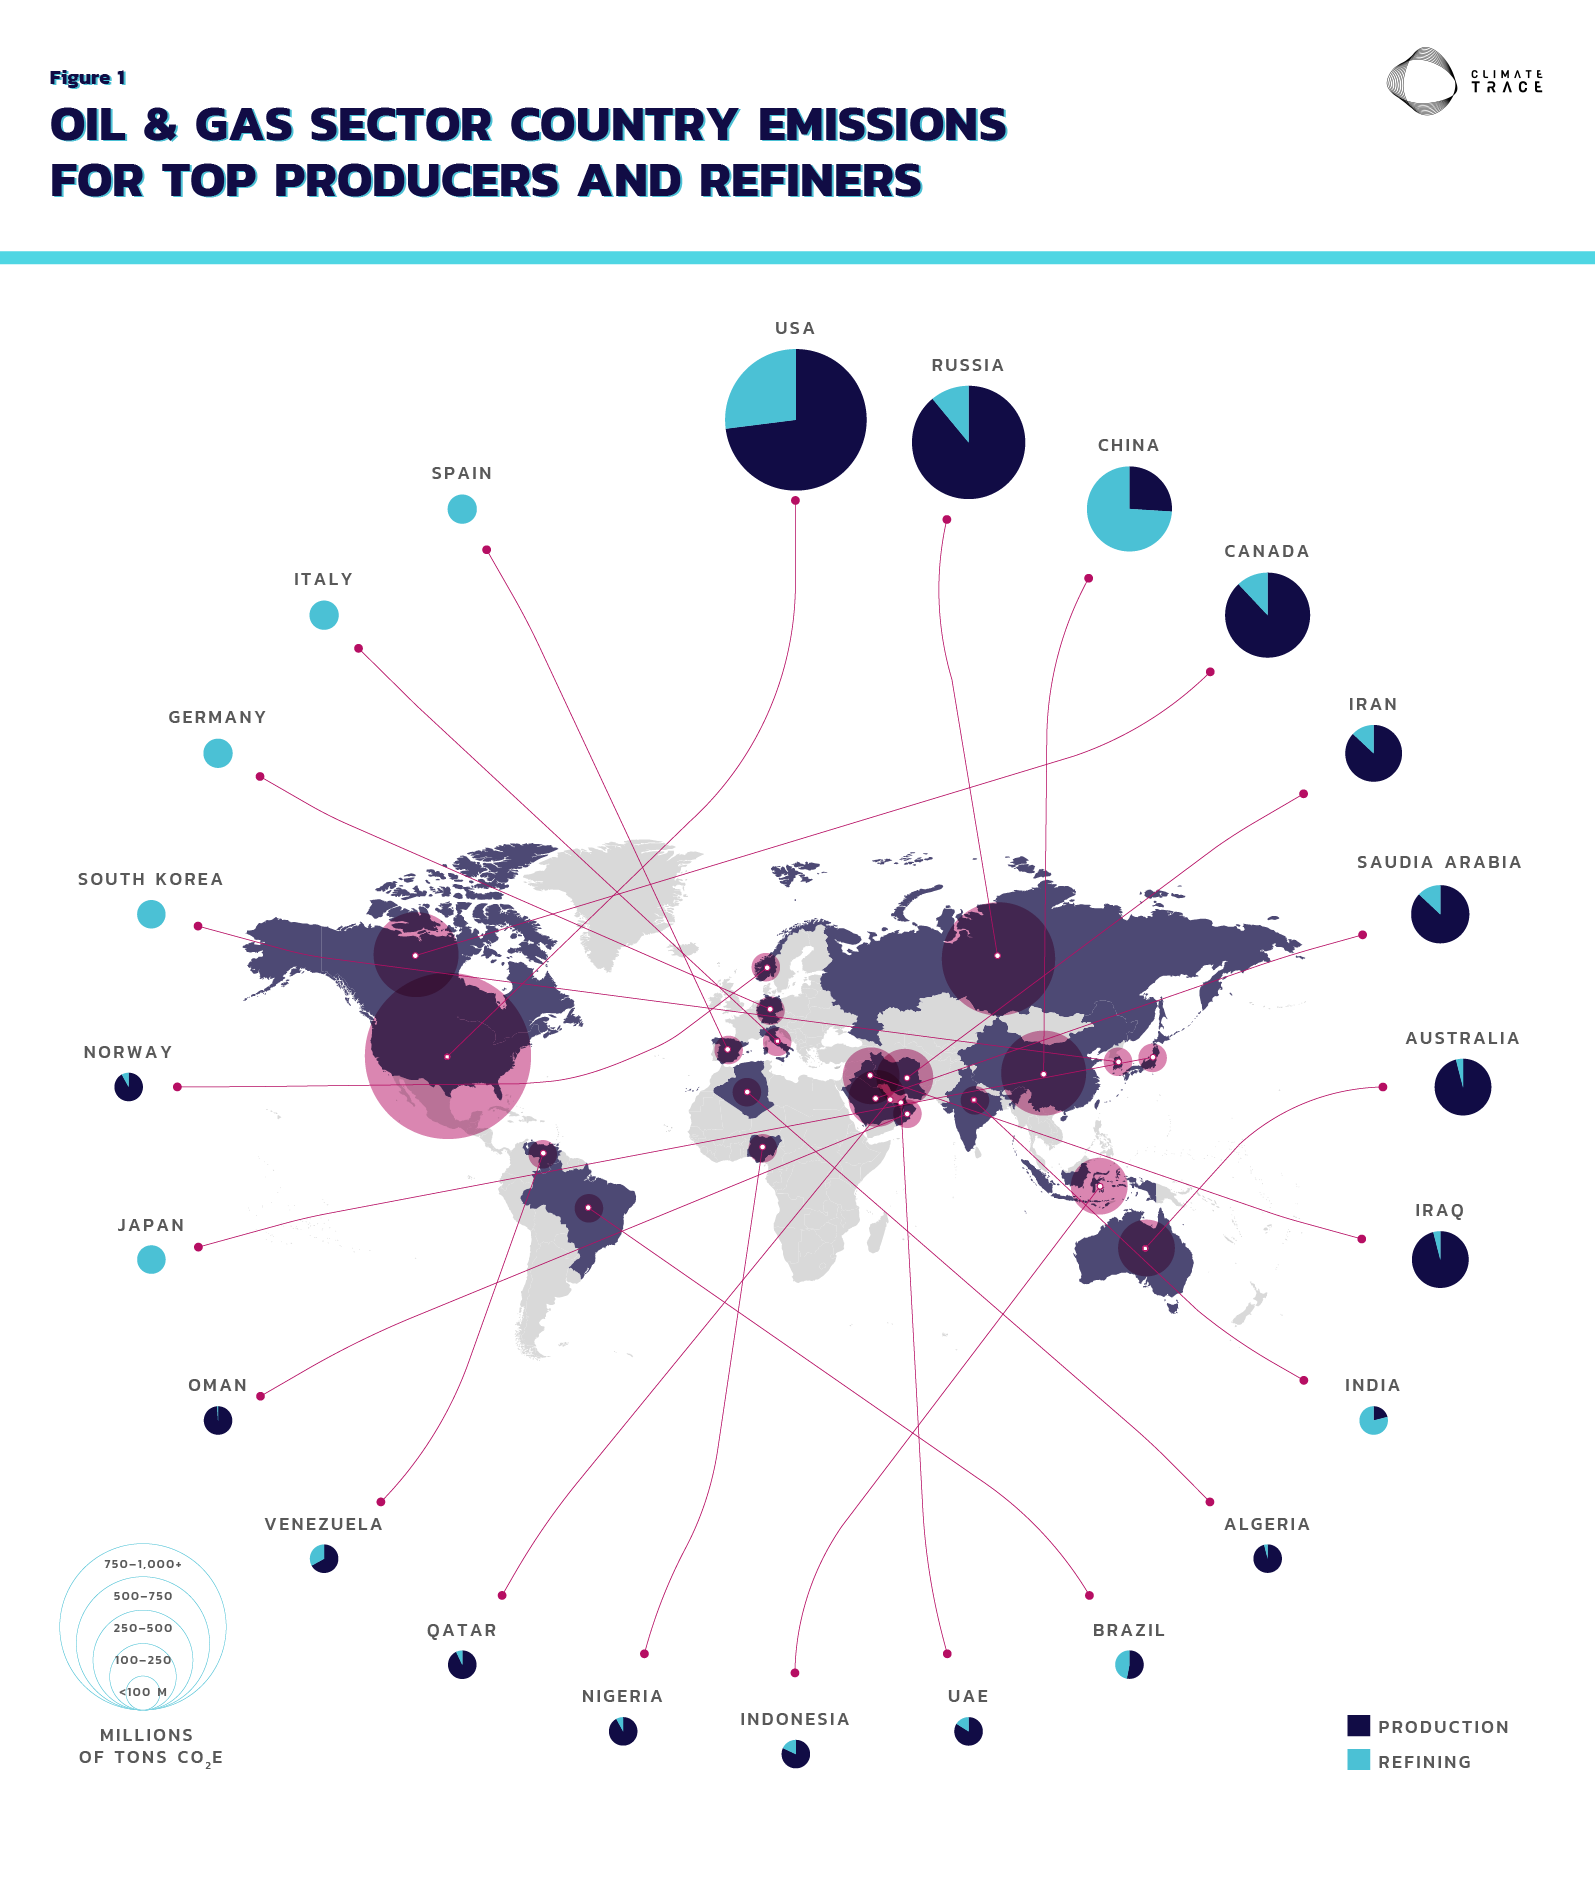
Up to 65% of the population are visual learners. That's a lot of people!

Now let’s layer in the complexities of technical writing, or teams that collaborate across language and cultural barriers. Suddenly, visual aids become less of a “nice to have” and more of a mission-critical “needs to have.”

How you bring your big ideas to the world in visual form takes a special type of skillset, and The Bridge Studio is here to deliver the results you need.

Choosing The Bridge Studio to develop your data visualizations and information graphics means:

  • you’ll deliver a greater impact because you’ll reach a larger audience;
  • you’ll be able to easily reshare your big idea in presentations, publications, and digital platforms; and
  • your brand will grow as your work attracts more attention.

Portfolio Samples

Our Process

The process of developing information graphics, data visualizations, or custom icon sets can take a few forms. Below are three scenarios we most commonly encounter.

1. You have a clear idea and some sketches you're coming to the table with.

This is by far the easiest way for us to get started. It’s also the most cost-effective. Sometimes people have their own sketch or diagrams they’ve produced in PowerPoint. Whatever you have, be sure to bring it with you to our first meeting.

2. You have an idea.

Ideas are great starting points, too. But before we get started, I’m going to ask you to write a concise paragraph for each information graphic or data visualization you want produced. Developing information graphics is all about distilling ideas into visual form, identifying the right visuals to represent each component, and mapping out their relationships to one another. Starting with a concise description will ensure the puzzle pieces are accounted for before we start drawing.

3. You have a dense report that you know is hiding some juicy visuals.

Send over that brilliant piece of writing that you know would benefit from some visualizations.

Let’s start unraveling this together. We’ll look for patterns in your writing, what big idea(s) everything hangs on, and what key messages you want to make sure your audiences don’t miss. Then we’ll start sketching things out together before making everything pixel-perfect on screen.

Pricing

If you’re ready for a quote, let’s schedule a call and dive into the details of your project. By understanding your goals and unique requirements, we’ll be able to produce a tailored approach and cost estimate that gets you to your goal.

I've developed information graphics that describe everything from international climate migration to how to make clinical experiences more joyful.

Hi, I’m Michelle Fox, the creative director and owner behind The Bridge Studio. I live for the thrill of designing data-driven projects that have the power to change the world. I love unraveling big ideas and creating information graphics that effortlessly convey complex topics in meaningful ways.

If you have a world-changing technology or idea you’re getting ready to share, I’m in business to work with you.

Learn more about Michelle

Let's get to work!

Wherever you are in the process, whether you’re still in planning mode, or were ready to publish yesterday, it’s never too early or too late to start the conversation.